
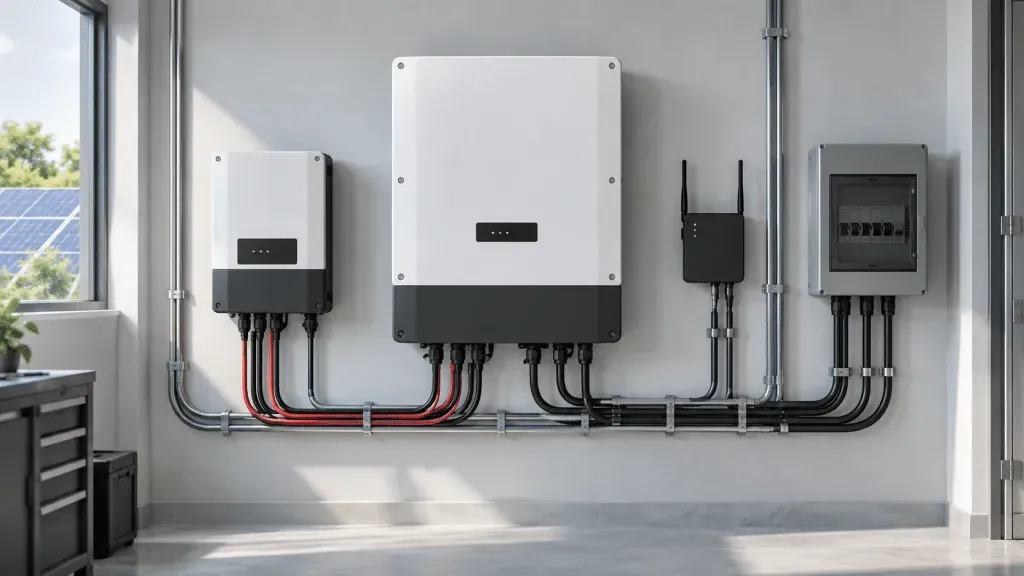
The DC/AC ratio is one of the few design decisions that changes the equipment list rather than the paperwork. Set it too low and you pay for inverter capacity the array never reaches. Set it too high and you buy modules whose best hours get thrown away. Either way the money is spent before anyone notices.
Most of the confusion comes from the ratio being presented as a number you should aim for. It is not. It is a result that falls out of the site, the mounting, the temperature range and the relative price of modules and inverters — and the useful question is not “what is the right ratio” but “what does this specific site justify, and how do I know the number I have been given is real”.
What the ratio actually measures
The DC/AC ratio is the array’s nameplate DC rating divided by the inverter’s rated AC output. A 120 kW array behind a 100 kW inverter is a ratio of 1.2. Nothing about that is an error; it is a deliberate decision about how often the inverter will be the limiting element.
The reason it is worth deciding rather than inheriting is that it sits upstream of everything else in the electrical design. The string length, the voltage window, the conductor sizing and the protection all move when the ratio does. Our inverter sizing guide covers the order those decisions should be made in; this piece is about the ratio itself.
The ranges that turn up in practice, and why they differ
These are starting points for a discussion, not targets. The spread between them is wide because the drivers are wide.
Reference table
Swipe horizontally to view all columns →
| Ratio | Where it commonly turns up | What is driving it |
|---|---|---|
| 1.0 – 1.1 | High-irradiance sites with a sharp midday peak; projects with a hard AC export ceiling | The array already reaches inverter limit often, so extra DC buys little |
| 1.1 – 1.3 | Commercial and industrial rooftops, temperate climates, fixed tilt | The common default: modules are cheap relative to inverter capacity, and peak hours are few |
| 1.3 – 1.5 | Ground-mount fixed tilt, mid to high latitudes, module-heavy BOMs | The curve is broad enough that clipping loss stays modest |
| 1.5 and above | Single-axis trackers, bifacial modules, high latitudes | Tracking flattens the daily curve, so the midday peak is less dominant |
| Set by the grid, not the site | Projects where the interconnection agreement caps AC export | The ceiling is contractual — more DC only moves the clipping earlier in the day |
Reading the table sideways is the mistake. A 1.5 on a tracker is not aggressive in the way a 1.5 on a fixed rooftop in a desert climate would be, because the shape of the production curve is doing the work, not the number.
Temperature moves the ratio without anyone changing it
Two sites with identical equipment and identical irradiance can justify different ratios purely on temperature. Module voltage rises as cells get colder, and the hours where clipping occurs are usually the high-irradiance hours — which on a cold, clear site are also the hours where the array is producing above its nameplate behaviour. A cold climate pushes the array past the inverter limit more often than a hot one at the same irradiance.
The converse also matters: in consistently hot locations, modules rarely reach their nameplate output, so the effective ratio in the field is lower than the ratio on the datasheet. This is one of the reasons a ratio copied from a project in another climate is not a safe starting point. The temperature range belongs in the model, not in the assumption.
Tracking and bifacial modules tolerate more DC
A fixed array produces a curve with a distinct midday peak. A single-axis tracker flattens that peak by holding the array closer to optimum through the morning and afternoon — the energy is spread across more hours, so the instantaneous power at noon is lower relative to the daily total. Because clipping only happens when instantaneous power exceeds inverter capacity, a flatter curve clips less at the same ratio, or supports a higher ratio at the same clipping loss.
Bifacial modules push the same direction, though more gently, because the rear-side gain tends to be proportionally larger outside the midday window. Trackers and bifacial together are the combination that most often justifies ratios above 1.4.
Where the ratio stops paying
Each additional increment of DC buys less annual energy than the one before it. Early increments are nearly free: the array was below inverter limit most of the year, so extra modules produce extra energy almost all of the time. Later increments only produce during a narrowing window of peak hours, and the energy they add has to be weighed against the cost of the modules that deliver it.
The test is marginal, not average. Ask what the next 0.1 of ratio adds in annual yield, and compare that against the annualised cost of the modules required to get it. When the added yield stops covering the added capital, the ratio has gone far enough — regardless of what the range table says.
A modest amount of clipping is normal and is usually cheaper than the inverter capacity that would eliminate it. What is not acceptable is clipping that nobody modelled, because it is invisible in the design and only shows up as a flat top on the monitoring curve.
The AC-side ceiling that does not appear in the ratio
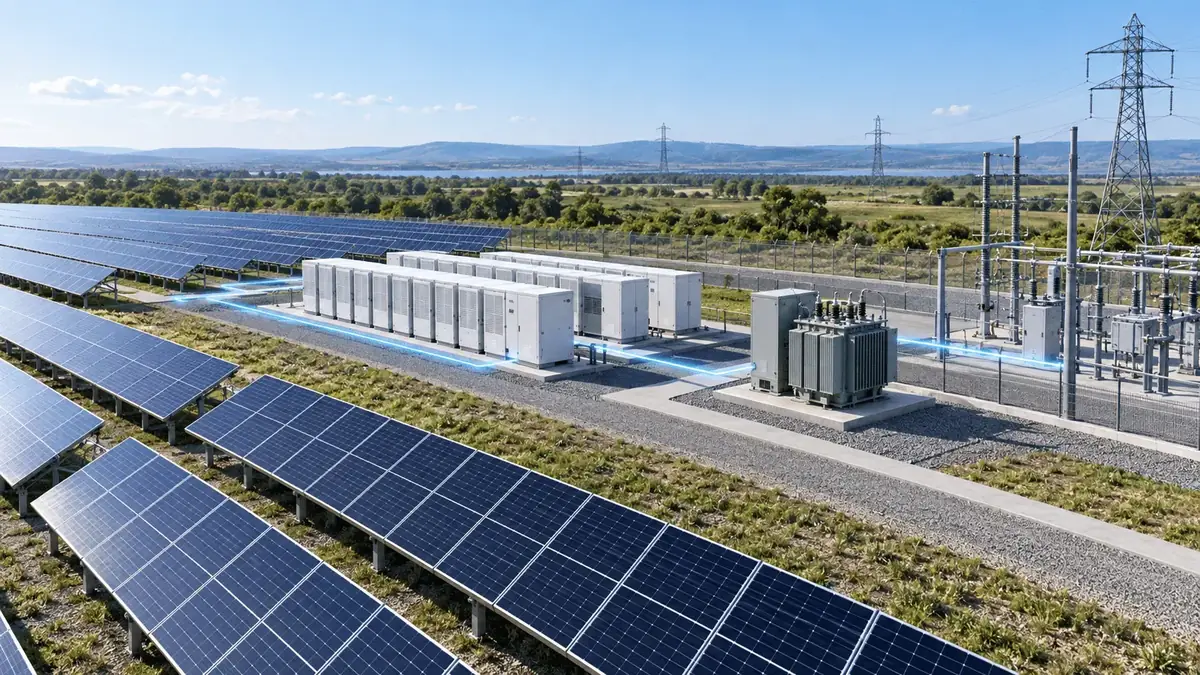
The ratio compares DC nameplate to AC nameplate, but the constraint that actually bites is often below the inverter’s rating. Utility interconnection agreements frequently cap export at a value below the installed AC capacity. Where that applies, adding DC does not increase delivered energy; it only starts the clipping earlier in the day and widens it.
The same applies to any site where the transformer, the switchgear or the point of connection is the limiting element rather than the inverter. Before accepting a ratio, confirm which element in the chain is the actual ceiling — see grid connection requirements for inverters for where those limits usually come from.
How to check a number before you accept it
A ratio is cheap to state and expensive to get wrong, so it is worth asking for the basis. Four things separate a modelled number from a guessed one:
- An hourly production file — annual yield and clipping loss derived from hourly (or better, sub-hourly) simulation for that location, not from a single-point calculation.
- The clipping loss stated as a number — in kWh and as a share of annual yield. If it is not stated, it has not been modelled.
- The temperature assumptions — the module temperature model and the ambient range used, since these move the result materially at higher ratios.
- Which element is limiting — inverter rating, export cap, or transformer. The answer changes the interpretation of the same ratio.
A supplier who can produce those four items is describing a design. One who cannot is quoting a habit.
Mistakes that cost real money
Treating clipping as a fault. A flat midday curve on a correctly designed plant is the design working. It is one of the most common reasons a healthy site gets investigated — covered in more detail in diagnosing plant underperformance.
Comparing ratios across climates. The same number behaves differently at different temperatures, so a ratio is only meaningful with its location attached.
Optimising the ratio before the layout is fixed. Roof obstructions, setbacks and string lengths constrain what is buildable; the ratio has to be chosen against the layout that will actually be installed.
Ignoring the export cap. Where the utility limits export, DC oversizing above the cap converts capital into clipped energy.
What we need to model it
Send the module model and quantity, the string layout if you have it, the mounting type, the site location for the irradiance and temperature range, and the interconnection or export limit. We run the ratio against your actual array and mounting rather than a generic default, and we state the modelled clipping loss in writing so the midday curve is expected rather than escalated. Start from solar modules and inverters and controllers, or send the layout and we will confirm the configuration before you commit.
BUYER CHECKLIST
Buyer considerations for this scope
Ask for the hourly model, not the ratio
Anybody can quote 1.3. Ask for the annual yield and clipping loss produced by an hourly simulation for your location, the module temperature model behind it, and which element in the chain is actually limiting. A ratio without those three is a habit, not a design.
Confirm the real ceiling before accepting extra DC
Inverter rating, utility export cap and transformer capacity are three different ceilings, and only one of them is in the ratio. Where the interconnection agreement caps export, additional modules only widen the clipping window instead of adding delivered energy.
Get the modelled clipping loss in writing before handover
A flat midday curve looks like a fault in the monitoring platform and is one of the most common reasons a healthy plant gets investigated. If the clipping figure is documented at handover, the curve is recognised rather than escalated.
PRACTICAL ANSWERS
Questions buyers ask about this
Does a DC/AC ratio above 1.0 damage the inverter?
No. Inverters are rated for a defined DC input range and are designed to limit output when the array exceeds the AC rating. Operating with more DC than AC is standard practice. What matters is staying inside the manufacturer's voltage and current window for the specific model at the site's temperature range, which is a string design question rather than a ratio question.
How much clipping loss is acceptable?
There is no universal threshold, because the answer depends on what the clipping costs against what the extra inverter capacity would cost. A modest loss — in the low single digits as a share of annual yield — is normally far cheaper than the larger inverter that would remove it. The test is marginal: if the next increment of DC does not add enough annual energy to cover its own capital cost, the ratio has gone far enough.
Can I use the same ratio on a tracker as on a fixed rooftop?
Usually not, and the tracker will justify the higher number. Tracking spreads production across more of the day and lowers the midday peak relative to the daily total, so the array exceeds the inverter limit less often at the same ratio. Bifacial modules push the same direction. This is why a ratio quoted without the mounting type attached is not a usable number.
Can the ratio be increased after the plant is built?
Adding modules to an existing inverter is possible in principle but rarely simple in practice: the string voltages, the DC conductors, the protection and often the interconnection agreement were all sized for the original array. Where extra capacity is needed, it is usually cleaner to add inverter capacity alongside it. Check the existing design limits before assuming spare DC headroom can be filled.
EXPLORE FURTHER